
Building a Sales Function
The following letter details some of our thoughts and guidance on building an effective sales function. We feel strongly that strong sales functions require simple and consistent processes and a data-driven approach. In this letter we map out a typical sales funnel and discuss key metrics to measure the health of a business’s sales function. We also compare two sample businesses. While this letter aims to be generically helpful across our broad client base, our goal is to prompt thoughtful discussions with our clients given their unique needs and circumstances.
Building an effective sales function within a business is very hard, and this usually comes as a surprise to most of our clients. Most entrepreneurs can sell, and the first few years of a business’s growth is driven by the founder owning the entire sales function. The inability to build out the sales function, in a way that is not dependent on the founder’s efforts, is one of the largest inhibitors to scaling over time. With our clients in particular, building out the sales function is one of the last major lifts prior to achieving real scale.
This topic of building a sales function, or a sales engine, with a small business has become a particularly passionate topic for us at Ballast, for multiple reasons. First, we see it as a major determinant of long-term success for our clients. Second, the ineffectiveness of a sales organization smacks us dead in the face at each monthly financial briefing. Third, we think with the right framework and approach, it is something manageable and addressable – it’s something we think we can help with. We love seeing our clients win; it’s what gets us up in the morning and to see them falter or fail because of something that we can think we can help with energizes us.
Why Ballast Is Positioned to Support
A mentor of mine once told me that the kings and queens of yesteryear built their castles atop hills, because…in the rather colorful language of this mentor, sh** flows downhill. His point when teaching me this crude aphorism is that when seeking to solve a problem in business trace the origins of the problem to the root cause. Fix the root cause, and avoid the unnecessary, sometimes painful, oftentimes expensive, and consistently repeated process of simply cleaning up the resulting mistake or in the words of my mentor ‘the solution, isn’t to catch and redirect the mess when it finally makes it downhill, the solution is to install a toilet and build a sewer.’
In our line of work at Ballast, we see all the issues of a business, the problems, inefficiencies, and mistakes, manifested in the financials. The financials are the proverbial valley at the bottom of the king’s hill. This is why we built a consulting business using finance and accounting as the foundation. We felt that any small business consulting practice would require a comprehensive understanding of the underlying business and we felt that the only way to capture all the appropriate information (and further to control the production of this reported information to ensure accuracy), would be to own the finance and accounting functions. Finance and accounting are our means of capturing, analyzing, understanding, and most importantly monitoring changes and improvements made within a business.
How Ineffective Sales Functions Manifest in the Finance and Accounting
The absence of a sales engine or the existence of an ineffective sales engine within a business manifest in a variety of ways. At Ballast, in our role owning the finance and accounting functions, we can see symptoms of a missing sales engine in the form of:
- inconsistent and lumpy revenue
- inconsistent gross margins
- flat revenue, or the absence of revenue growth
- unhealthy levels of spend on advertising, sales, and marketing relative to gross profit,
- the inability for a team to forecast revenue with any level of confidence.
The symptoms we see almost always cause greater harm even further down the line. Lumpy revenue can drain a team’s energy as they swing from overcapacity to over-resourced (feast-or-famine culture). Inconsistent gross margins can decrease the management teams’ confidence in investing in the business and result in underinvestment.
We believe that growth is good for employee development and progression and alternatively the absence of growth can put a ceiling on employees, which results in turnover. Too much spend on sales and marketing relative to gross profit can prevent a firm from attaining appropriate levels of net profit, which can translate to a host of issues. An inability to forecast revenue almost always causes a mismatch between team resourcing and demand, further exacerbating that pendulum swing of feast-or-famine.
Frame of Mind
We will be the first to admit that we are not experts in building sales organizations. We are not certified implementors of any variety of sales methods. We simply see and report on the resulting, downstream impacts of an ineffective sales function. As our clients’ financial co-pilot, we find ourselves in a position where we have been able to directly, positively impact firms by building or improving their sales functions using a process-driven approach.
We believe that building and managing an effective sales function starts with the right frame of mind. We don’t have a fancy industry term for this frame of mind, nor do we have some trademarked acronym to explain it. (Like I said, just be patient with us finance nerds as we work to explain our viewpoints on this topic). We believe the below factors establish the appropriate frame of mind for building an effective sales organization.
Simplify sales and the sales process as much as possible. We have a saying at Ballast that we feel directly translates the sales function – make things as simple as possible and only as complex as necessary. In no particular order here is why simplification is key.
Confused buyers simply don’t buy.
Complexity provides obscurity and can delay decision making. One advantage small businesses have over large businesses is their ability to make and implement decisions quickly. Complexity can eliminate this advantage.
Simplification is the bedrock for accountability within the sales organization.
These days we are seeing somewhere between a 10%-20% hit rate on new sales hires – amongst our clients over the past year, only somewhere between 1 or 2 of every 10 new sales hires functions and performs successfully in their role. The key for management is to quickly identify and manage out the underperforming sales roles, marketing campaigns, and sales strategies. Underperformance has a more difficult time hiding in a simple sales process than a complicated one.
Simplicity breeds consistency and faster adoption.
Standardize where possible.
Nothing works against sales velocity faster than treating every single sale as a precious and custom-tailored deal with bespoke pricing, terms, and conditions. Standardize deals as much as possible to accelerate sales velocity.
This applies after finding product-market fit. Prior to finding product-market fit, most firms are flexible on deal structure and terms to find the right fit. Note the risk here, most firms become comfortable with custom-tailoring deal terms, and they linger in this stage for too long. This eventually works against the desired goal of scale.
Standardization also works to embed fungibility within the sales organization, which allows for handoffs between team members. This decreases the risks of single-points-of-failures.
Process matters. Work the process to produce the result.
We are huge believers in Deming’s school of thought here, he said ‘the right process produces the right result.’ This isn’t just an operations concept; we believe that this directly applies to sales. The best sales organizations we have seen use processes to drive results, not people. Personally, I’ll take a team of okay-sales people combined with the right process vs. a team of hot-shots with no adherence to a process any day of the week.
Data is your friend, be objective and use data to inform.
I don’t know why this is the case, but in our experience, salespeople tend to avoid (and some even go so far as to abhor) data. How many times have you heard lines like ‘you just don’t understand, this is a relationship game’ or ‘closing a sale is as much about feeling as anything’ or a personal favorite of mine ‘you can’t reduce this role to numbers on a page.’ Good sales organizations can routinely and consistently report objective data to their teammates and management and this objective data drives fast and good decision making. Bad sales organizations don’t even understand what I just wrote.
The best sales organizations are custom-built and tuned to the needs of its organization. There is no silver bullet, no one-size-fits-all approach and each organization must build a sales organization that is tuned to its needs.
There are a variety of inputs at a dozen or so stages that can result in tens of thousands of possible designs for a sales organization. Do not make the mistake of taking something from another organization, copying it verbatim, and applying it to your business.
As true as this might be, the materials and principles used across businesses are the same. Snowflakes may all be unique, but they’re all ice crystals and each is formed when cold water freezes onto a dust particle. We also love the ‘home’ analogy here for sales organizations. Each home should be custom designed to the needs of the family that reside within it, but each home is built using roughly the same materials and same engineering principles. Don’t make the mistake of thinking that because your home is custom built, it must be built with custom materials and inputs.
Tie the sales metrics to the financials to hold the sales organization accountable to the financial performance of the organization. As simple as this concept is, we often see sales metrics which do not tie easily to the financial performance of the organization (often due to timing delays between bookings and revenue) and the results can be disastrous. The most obvious symptom of this is when we see the sales team celebrating month after month due to hitting their bookings goals, but the rest of the company is left wondering why the financial performance of the company has not improved.
Revenue Lifecycle Framework
In addition to the above frame of mind, we have developed a framework that maps out the entire revenue lifecycle of a business. This framework has been extraordinarily helpful for us in analyzing and improving sales functions for our clients.
Using this framework requires a holistic view of the sales function within an organization; it is also adaptable to almost any business and can be used to build a custom-designed sales function within any firm. As stated above, we don’t believe in a one-size-fits-all approach to a sales function within a business, and frankly we think this is where other consultants get it wrong; they identify a single element within this framework, calculate some metric, and then highlight to the client the need to make improvements or changes to this area without understanding how this function plays a part in a bigger picture.
We view the revenue lifecycle as an expanded sales funnel. Top of the funnel is the inbound flow of clients and future revenue. The middle of the funnel is the traditional sales operations function of filtering, scoping, pricing, and working leads through the system. The last major element of the funnel is the delivery, execution, and quality management elements of a business, which have significant ramifications for the design of the sales organization.
Here is an overview of the framework with talking points for each stage:

Applied Examples
Let’s apply the proposed frame of mind and the above framework to a few example companies.
Company A:
For our first example, let us imagine an established business with long-term and experienced sales roles. The company generates around $550k/month in revenue. This firm does not spend much if anything on the Awareness stage. It does not engage a marketing firm to help with content or SEO/SEM. It contributes to the same local business networks every year (call this general advertising). It has never once contemplated spending money on SEO or SEM. And the last time it tried outbound sales was in the late 80’s when fax machines were still the newest technology on the market.
This company employs four full-time salespeople, all very experienced and well-networked. These roles have mid-level base compensation with the ability to earn up to 100% of their base comp in the form of commissions.
The firm operates with standard market gross margins (around 35%) and the firm employs a client success role that does nothing but communicate with existing customers/clients to ensure they are happy with the product/service and ensure they do not have any questions. This client-success role is compensated with a base salary plus a small commission based on contract/client renewals.
This firm has very little client/customer attrition. The firm adds around 1 new client / month, and each client lasts around 48 months (a 48-month tenure is an implied attrition rate of ~2% per month). The firm is growing topline revenue by around 4% per year (not accounting for inflation in this example or changes to pricing that are purely driven by inflation over time) and operates with a 15% Ebitda margin, which is near market for a firm in this industry of this size.
Let’s consider for a moment how the above might translate into our framework.

See the appendix for an overview of the P&L with some accompanying metrics for Company A.
Does this company have a healthy sales organization / function? What information would we use to answer this? What questions should we ask?
Using the above framework, tying this all to the financials of the company, and using some basic favored metrics of our firm we would conclude that yes, this firm has a healthy sales function:
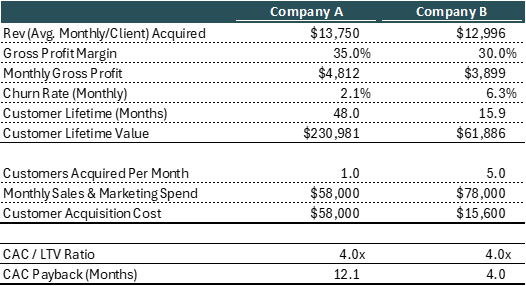
At $550k / month in revenue over 40 clients, that means each client on average is providing around $14k / month of revenue. At a 35% gross profit margin, each client provides around $4,800 / month of gross profit. If the client tenure is around 48 months on average, that implies that each client will provide $231k of gross profit over its lifetime with the company. For this example we can call this lifetime value or LTV.
LTV alone is not a particularly helpful number, but if we compare this LTV to the cost of acquiring the customer (CAC) and if we consider how long it would take on average for the CAC of a customer to be paid back via its monthly gross profit, we can learn an immense amount about the sales function of an organization.
Let’s start by analyzing LTV relative to CAC. LTV is the lifetime value a company receives in the form of margin from a client (admittedly some people and other groups calculate LTV using gross rev and not margin…but we think this misses a vital element of the analysis). CAC is what it costs to acquire each client on average. In our example above, we’re spending $58k/month for four salespeople, those four salespeople combined manage a sales funnel that provides around 5 leads per month, and together they close around 1 new client / month. If this company is landing 1 new client / month and the company is spending $58k / month, the company is effectively paying $58k to acquire a client or customer – pretty simple. Again – this number alone isn’t helpful because we can’t identify if it is high or low.
What is helpful and insightful however is looking at the LTV and CAC relative to each other. You can think about LTV relative to CAC as the equivalent of looking at a return on investment (ROI). Each month the company spends $58k, lands one client, and this client provides around $230k of gross profit over a 48 month period. This is an LTV / CAC ratio of around 4 ($230k/$58k).
This means that the company will receive a 4x return on the initial $58k. We feel this is a good ratio. We like to see LTV/CAC ratios north of 3. The best organizations we’ve seen and analyzed have LTV/CACs between 4-6x. Anything north of 1x means we’re getting a 1-for-1 return on our $58k, meaning the sales function is at best only covering their own costs. Below a 1x means the sales team is not covering their own costs.
Now here is where it gets even more interesting, and this next level of analysis is something that we at Ballast have grown particularly fond of analyzing – that is the CAC payback period. If the LTV/CAC is a measure of the return on spend, the CAC payback period is a measure of the capital efficiency of that spend. Said another way – CAC is what it costs to land a client, LTV is the total value we can expect to receive on this client, and CAC payback period is how long it’ll take for the margin generated on this client to payback our CAC.
Using the above example, the CAC per client is around $58k. And each client generates around $4,800 / month of gross profit once landed. This would mean that, from an investment perspective, the company is ‘in the hole’ on the sales spend for around 12 months. The company spent $58k, and the company receives $4,800 / month in benefit.
CAC Payback Period (Months) = CAC / Monthly Gross Profit
We at Ballast like to see CAC payback periods below 12 months. Anything north of 24 months is very, very burdensome from a capital perspective of a company. Anything between 18 months and 24 months is not good. Anything 12-18 months is okay. 9-12 months is good. 6-9 months is very good. And if a company can successfully land clients and have the costs of landing the client paid back in under 6 months, this is a very attractive payback period.
The relationship between these two sales metrics, LTV/CAC and CAC Payback period is particularly interesting. Consider for a moment if we take the above company example and change some assumptions to produce a very attractive LTV/CAC – say 6.2x. For fun, let’s say the company hired a top-notch MBA graduate who worked at McKinsey previously and this person’s role was improve this LTV/CAC ratio. If we only looked at the LTV/CAC (like a lot of other consulting firms who shall not be named), we might celebrate. But if we do our diligence and analyze this situation in a little more depth, we find that the payback period extended to 16.2 months. We find out that in order to grow the LTV/CAC this new hire slashed prices and hired additional client success roles to keep clients particularly happy. The result is a gross margin of 30%, not 35%. Ebitda margins would contract from 15% to 9%.
Additionally, the cash needed to achieve the same rate of revenue growth would materially increase as the payback on each new client would be lower. Obviously, this is an exaggerated example, but hopefully you get the point that in isolation, one can take steps to materially improve LTV/CAC (especially if one calculates LTV using gross revenue instead of gross margin), but that these steps can have materially negative ramifications if not well understood. Lesson and recommendation – never view a single sales metrics in isolation, always consider the host of metrics available to fully understand the health of a sales organization.
Company B:
Our second example also starts the year with around $550k/month in revenue, but it is a higher revenue growth business; it grew revenue by 45% over a 12-month period. The sales team is landing 5 new clients per month on the same size sales team as Company A. The difference is that Company B is spending around $20k/month on content, PR, and an outsourced outbound sales team which provides warm leads into the team’s sales funnel. These efforts are feeding Company B’s funnel with 20 leads per month (4x that of Company A) and Company B is converting 25% of these leads into closed deals and new clients (vs. the 20% close rate of Company A).
Additionally, despite this additional $20k/month of spend in sales and marketing to drive the top-of-funnel activity, the client’s CAC is ¼ that of Company A, because the team is landing five time as many new clients per month. This low CAC has materially improved the CAC payback period (only 4 months for Company B).
Viewed in isolation, the above information would lead you to believe that Company B has a more effective sales function, however a more comprehensive analysis highlights why this is in fact not the case.

Company B may in fact have the same LTV/CAC as Company A, and Company B may have a materially shorter CAC payback period. Additionally, no one can argue that Company B is landing more clients per month and that this is driving higher revenue growth and the low CAC. The issue however is that Company B has materially higher client attrition (6.3% / month vs. 2.08% at Company A) and materially lower client tenure (16 months vs. 48 months at Company A). This client turnover has costs which can be seen with COGS of around 70% of revenue vs. 65% at Company A. This COGS is being driven directly by the client attrition, as it’s more expensive and time consuming to launch new clients each month.
The result of this higher COGS and higher monthly attrition is that Company B is paying more in COGs and sales and marketing for the revenue growth and earnings are $270k lower at Company B than Company A (26%) – all on the same level of starting revenue. Company B is decidedly less attractive when considering earnings.
What we find when pushing our analysis further is that the $20k / month spent to generate the 20 warm leads, which then convert at a higher rate of 25% vs. the 20% close rate of Company A, is providing more clients, but not more high-quality clients. This outbound sales model is providing more inbounds, and it is certainly providing more client additions per month, but the model is providing lower quality overall clients who tend to price shop and vendor hop more often. This is why the average client tenure at Company B is only 16 months vs the 48-month tenure of company A.
Conclusion
Building a long-term sales engine within a business is difficult, but it’s not impossible. We want to help our clients work through this important issue and we think we some context in the form of our ‘frame of mind’ and this framework provides a great starting point.
Remember that good sales should be simple, standardized, process driven, supported with data, custom built, using standard inputs, and tied to the financials of a firm. Avoid complexity and avoid making decisions based on personalities and specific people. Avoid the pitfalls of the subjective and relational only approaches to sales. Avoid the silver bullet consultants with their one-size fits all approach to building a sales function. Remember that although your organization is unique and although the sales function should be thoughtfully designed and crafted, the materials to construct it should be standard. And lastly, always remember to tie in the financial performance of the overall firm to any sales metrics used to manage the sales organization.
Building an effective sales organization is not easy, but it’s not impossible either. It does take serious consideration and intensely focused effort. It does not need to be built alone, however. Although we are not experts on building sales organizations, we have experience supporting our clients through the process. Lean on us as you work through the build out and review of your sales function.
-Kyle Benusa, Jack Allen